Three arms, two axes, zero units. Look at it before anyone measures it.
Tap to open the full chart — above, it cycles through the whole thing and its own details.
Listen — four voices, no charge
Press play before you read a word.
The chart argues with its own measurements: the curve, the time diary, the tax return and the worker at the bottom of the U. Turn Follow the page on and it scrolls to whatever's being discussed; tap any line of the transcript to jump there.
Lesson 19 · pay is not title
The U-turn
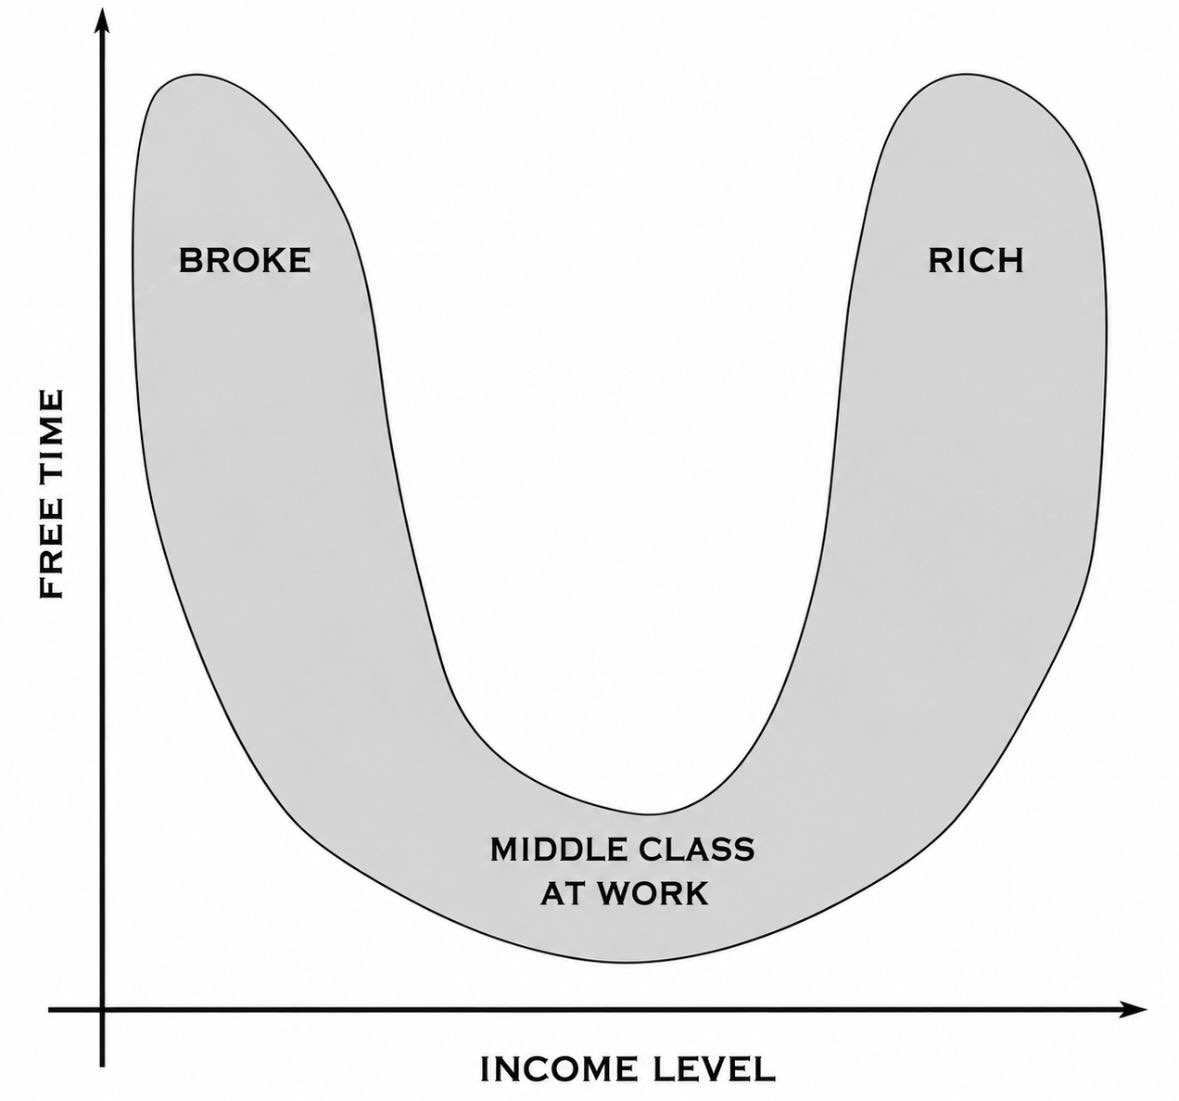
A chart went around saying the broke and the rich both have free time and the middle class has none. It feels true, and one arm of it is in the data. But the x-axis does something the chart never admits: halfway across, it stops measuring how much you are paid and starts measuring what you own. Up to that point, more pay buys less free time, not more. The right arm isn't the end of the income line. It's a second axis, bent up to meet the first.
The specimen
Right about one arm. Wrong about the bottom. Silent about the turn.
It circulates the usual way: no byline, no source, built to be screenshotted whole. It has no numbers to check: no tick on either axis, no survey, no year. So this lesson checks it against the numbers that do exist, which are the time diaries people fill in minute by minute and the tax returns that say where income comes from.
Tap to open it at full size.
Here is the result in one line. The left arm is real in hours, and the hours are not free. The bottom is in the wrong place. The right arm exists, but not on this axis.
Four frames
One curve, drawn through three different populations.
01 · Broke
Americans who aren't employed log 6.66 hours of leisure a day, against 4.17 for the employed. The arm is real. What those hours are is the question, and it gets its own section below.
02 · Middle class at work
Measured, the second earnings quartile has the most leisure of any full-time earners, 4.43 hours a day. The chart puts its lowest point where the diary puts its highest.
03 · Rich
The top earnings quartile has the least leisure, 3.71 hours, and the most people at work on any given day. The arm only rises once the income stops being a wage, and that's a different axis.
04 · The axis
No ticks, no units, no source. "Income level" is doing two jobs: how much comes in, and whether you have to show up for it to come in.
The instrument
Put the measurements on the chart's own axes.
Same frame, same orientation, with leisure hours per day on the vertical axis. The blue dots are the 2025 American Time Use Survey: full-time wage and salary workers split into four equal groups by weekly earnings, plus everyone not employed. The red dashed arm is drawn, not measured, because no time-use survey samples enough of the people at the very top to plot them. What can be measured for them is where their income comes from, and that's the next section.
Fig. 1 — the U, unstitched
One axis called income level. A U with no units. Every reader supplies their own scale, which is why it feels true to everybody.
Leisure per day, full-time earners: 4.20 · 4.43 · 4.05 · 3.71 hours, lowest pay to highest. Not employed: 6.66.
There is no right arm. Past the second quartile, more pay buys less free time. The top quartile works the longest weekdays (8.62 hours) and is the most likely to be at work on any given day (73.8%).
The arm rises only where income stops being payment for hours. In Canada, the bottom 99% get 6.4% of their income from dividends, interest and other sources. The top 0.01% get 43.8% from them.
The U is two curves, stitched where the blue line ends: the wage curve on the left, the ownership curve on the right. The chart calls the seam “income level” and never shows it.
Press Measure the earners and the bottom of the U turns out to be the top of the measured curve: the $841 to $1,320 a week group, which is about as middle class as a quartile gets, has more leisure than anyone else drawing a full-time wage. After that the line only goes down. Kuhn and Lozano found the same thing over a generation: the rise in American men working more than 48 hours a week was “greatest among highly educated, highly-paid, and older men.”
Press Add the owners and the right arm comes back, attached to a different question. It doesn't measure how much you make. It measures whether anything you own makes it while you are elsewhere. That's the horizontal axis on this site's map, ownership, and the chart has bent it upward and glued it onto the end of a pay scale.
The output
Two questions under one arrow.
Separate the flattened axis and each half has its own record. One is a time diary, and the other is a tax return.
Does more pay buy more free time?
Paid for your hours · the time diary
No. Among people who earn their income, it buys less, and the steepest drop is at the top.
Leisure, hours per day: 4.20 → 4.43 → 4.05 → 3.71 by earnings quartile, full-time wage and salary workers (BLS, American Time Use Survey 2025, Table 11A).
Weekday hours worked: 8.01 → 8.34 → 8.49 → 8.62. Share at work on an average day, top quartile: 73.8%, the highest (Table 5).
Long hours, Canada 2023: 26.0% of the self-employed worked 49+ hours a week, against 5.5% of employees (Statistics Canada). Owning the shop is not owning your time. Owning the shop means you are the shift.
Does owning buy free time?
Paid for your title · the tax return
That's the only place the right arm can live, and in Canada it starts well above the top 1%.
Top 1% (from $293,800 in 2023): 61.5% of income still from wages and salaries, 26.4% from dividends, interest and other income. Still mostly paid to show up.
Top 0.01% (from $3,487,600): wages down to 50.8%, from 67.3% in 2016, and dividends, interest and other income at 43.8%.
Bottom 99%: 67.1% from wages, 6.4% from dividends, interest and other income. Capital gains aren't counted in these totals, so the owners' share at the top is understated (Statistics Canada, High-income Canadians, 2023).
The left arm
Hours nobody bought are not hours you own.
The broke arm is the one part of the chart the diary confirms: people without a job log far more leisure. But the vertical axis says free time, and the research on how those hours feel and where they go says otherwise. The axis that's missing here is this site's other one, control: who decides what your day is for.
30–40%of lost market hours in the Great Recession went to home production, not leisure. Another 30% went to sleep and television. Other leisure absorbed only 20% (Aguiar, Hurst & Karabarbounis).
SadderUnemployed people find their leisure less enjoyable and report more sadness during the day. The sadness drops “abruptly at the time of re-employment” (Krueger & Mueller, 2012).
7.8%of Canadian employees in the lowest wage quartile hold more than one job, against 3.4% in the highest. The top reason given is financial necessity. Broke often means working twice, not resting (Statistics Canada, 2023).
So the left arm has hours with no say over them: the job search, the second shift, the waiting room. The right arm has hours that title buys back. Both sit at the same height on the chart, and they sit at opposite ends of the control axis.
The chart's x-axis makes a U-turn. Up to the middle it measures what you're paid for your hours, and more pay buys less time. Past the middle it quietly starts measuring what you own, and only there does free time come back.
Its y-axis does the same thing in reverse: it files hours nobody bought next to hours title bought, because both are empty of work. Separate the two axes into ownership and control and the U is two separate stories. Neither of them is a middle class at the bottom of a curve that everyone else got out of.
Share the frame
Eight ways to unstitch the U.
Each tile is ready to post with a link back to the lesson. Choose the part of the argument you want to carry.